Reports and dashboard
See how your shop is doing on the Dashboard, and run, export and print sales, money, tax and stock reports.
GoResiti gives you two ways to see how the business is doing. The Dashboard is a quick snapshot you see every day. Reports are detailed tables you can run for any date range, export to a spreadsheet, or print.
#The Dashboard
Open Dashboard from the left menu. It shows figures for the dates and store you pick at the top right: From, To and Store. When you first open it, it shows today.
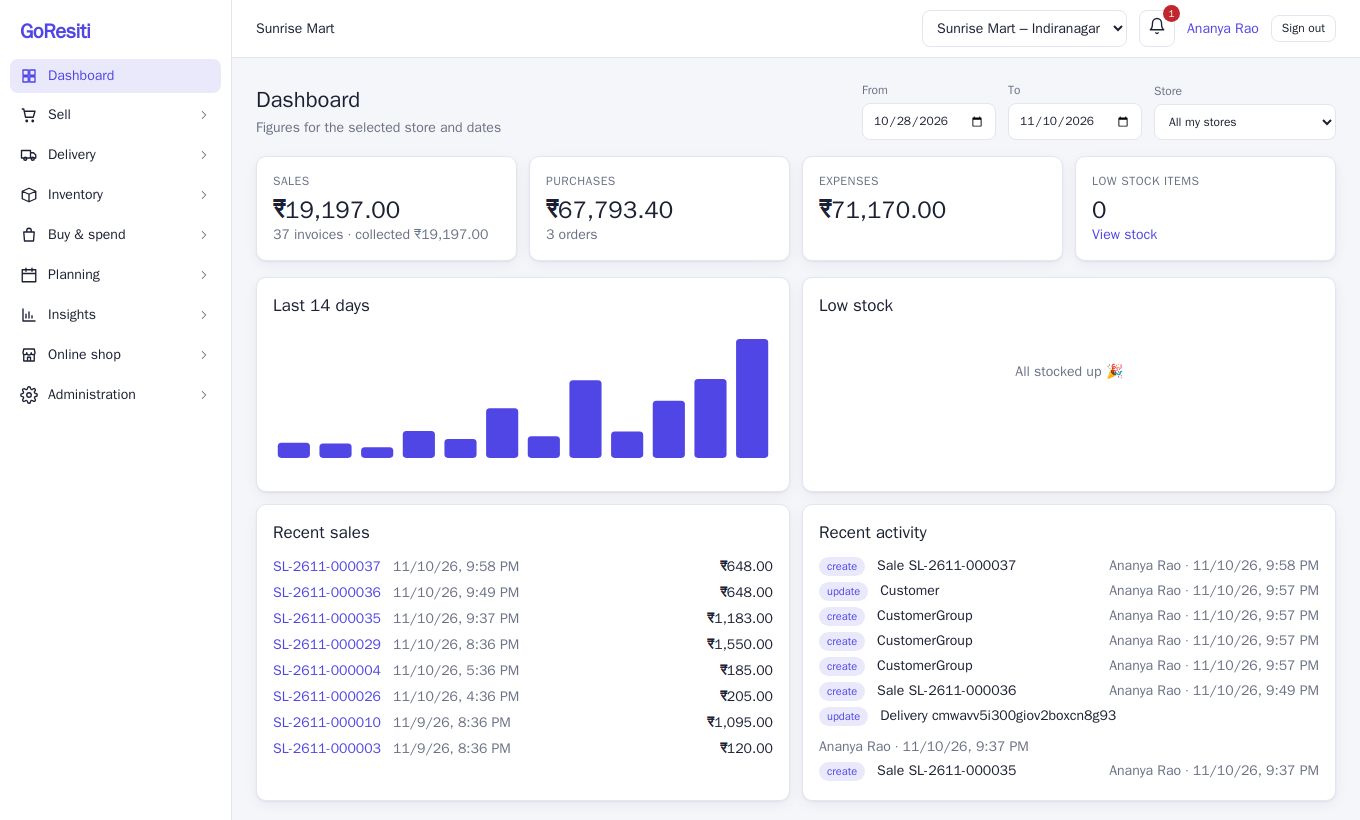
The four tiles at the top are:
| Tile | What it means |
|---|---|
| Sales | Total value of completed sales in the period, the number of invoices, and how much of that has been collected (paid). |
| Purchases | Total value of purchase orders in the period (cancelled ones are left out) and how many orders. |
| Expenses | Total of active expenses in the period. |
| Low stock items | How many products are at or below their alert quantity. Click View stock to open the stock page. |
Below the tiles you will see:
- Last 14 days – a bar for each day's sales. Hover over a bar to see the date and amount. This chart always covers the last 14 days, whatever dates you chose at the top.
- Low stock – up to ten products running low, with the quantity left.
- Recent sales – your latest sales. Click an invoice number to open it.
- Recent activity – the latest changes made by your team (for example a sale created or a backup taken).
#Opening a report
- Click Insights in the left menu, then Reports.
- Choose a report from the list on the left. The list is grouped under Sales, Attenders, Money, Tax and Inventory.
- Set From and To. The end date is included. Dates follow your business time zone, which is shown under the page title.
- Choose a store from the store drop-down, or leave it on All my stores.
- Click Run.
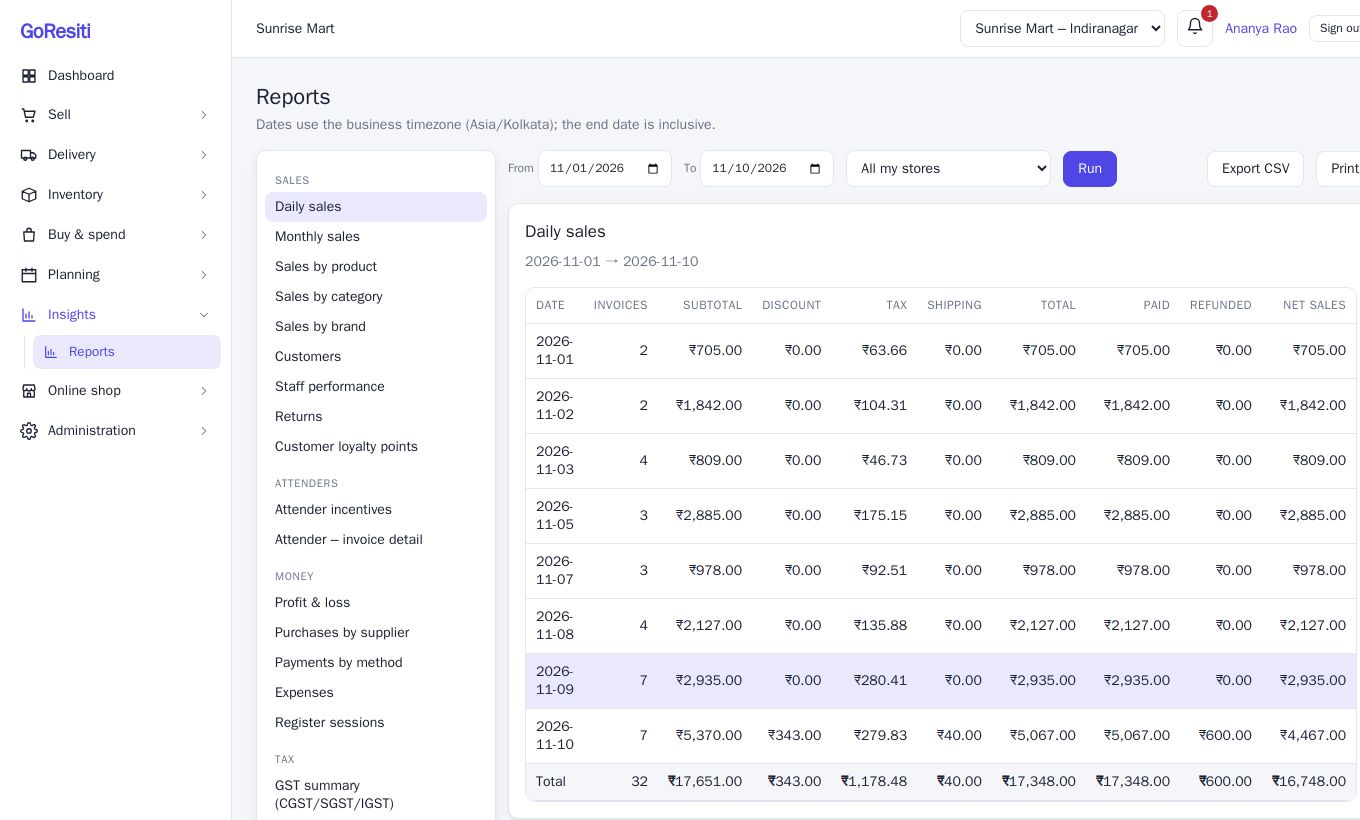
By default the dates start at the first of the current month and end today. Clicking a report in the list runs it straight away with the dates already set; change the dates and click Run again to refresh.
The result appears as a table with a Total row at the bottom for the columns that can be added up.
#Export and print
Once a report is on screen, Export CSV and Print appear at the top right.
- Export CSV downloads the table (including the total row) as a file you can open in Excel or Google Sheets.
- Print prints the report, or lets you save it as a PDF from your browser's print window.
#Which reports can I see?
Every plan includes Daily sales, Monthly sales and Sales by product. The rest of the list needs a plan with the full report suite. The two attender reports also need the attenders feature, and Customer loyalty points needs loyalty points to be switched on for your plan. Reports your plan does not include simply do not appear in the list. See Plan and billing.
To open the Reports page at all you need permission to view reports. A role such as Report Only is handy for an accountant who should see numbers but not change anything.
If you have access to only some stores, reports include only those stores.
#Sales reports
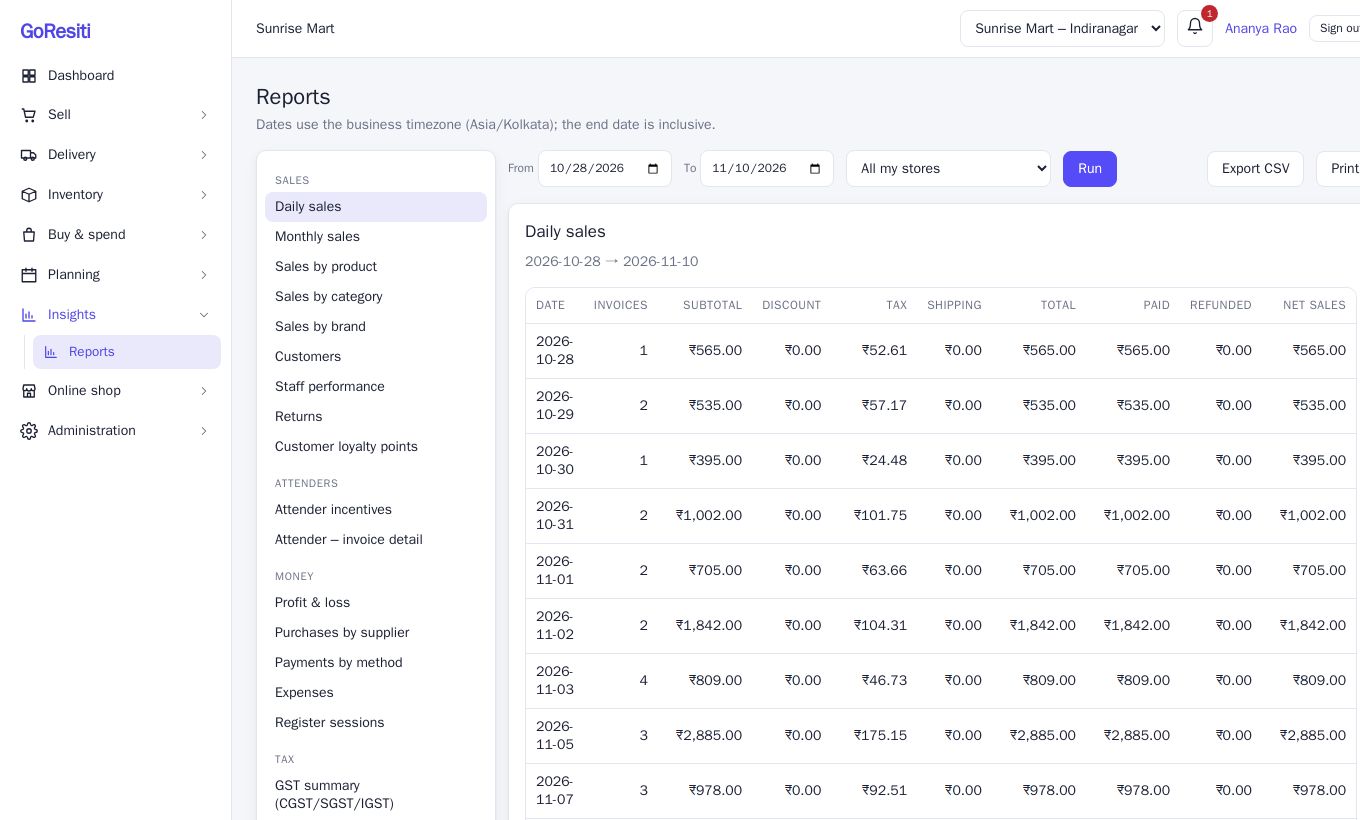
- Daily sales and Monthly sales – one row per day or month with the number of invoices, subtotal, discount, tax, shipping, total, paid, refunded and Net sales. Net sales is the total minus anything refunded.
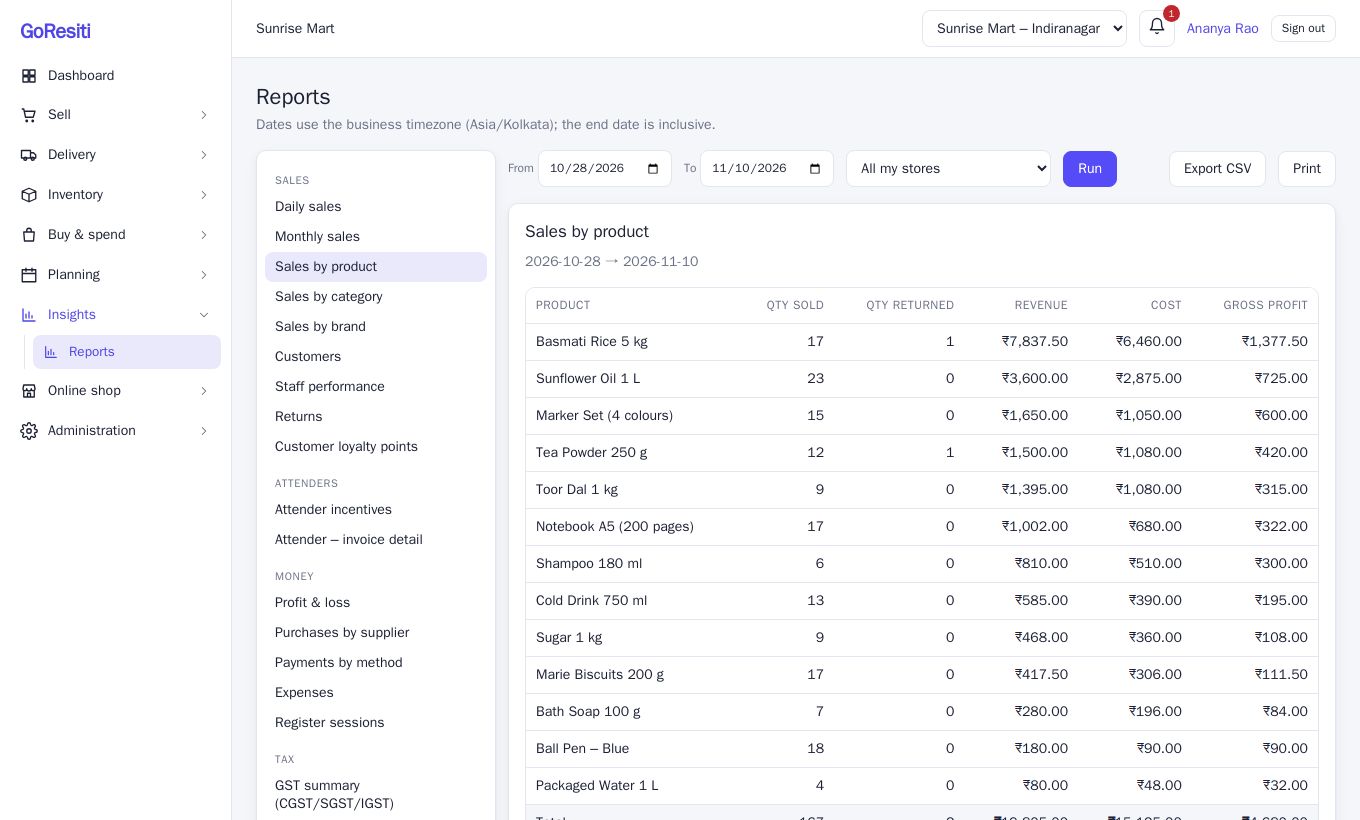
- Sales by product – each product's quantity sold, quantity returned, revenue, cost and gross profit (revenue minus what the stock cost you).
- Sales by category and Sales by brand – the same idea, grouped by category or brand. Products with none are grouped as "Uncategorised" or "No brand".
- Customers – what each customer bought, what they got refunded and what they still owe. Customers not saved in the system are grouped as "Walk-in".
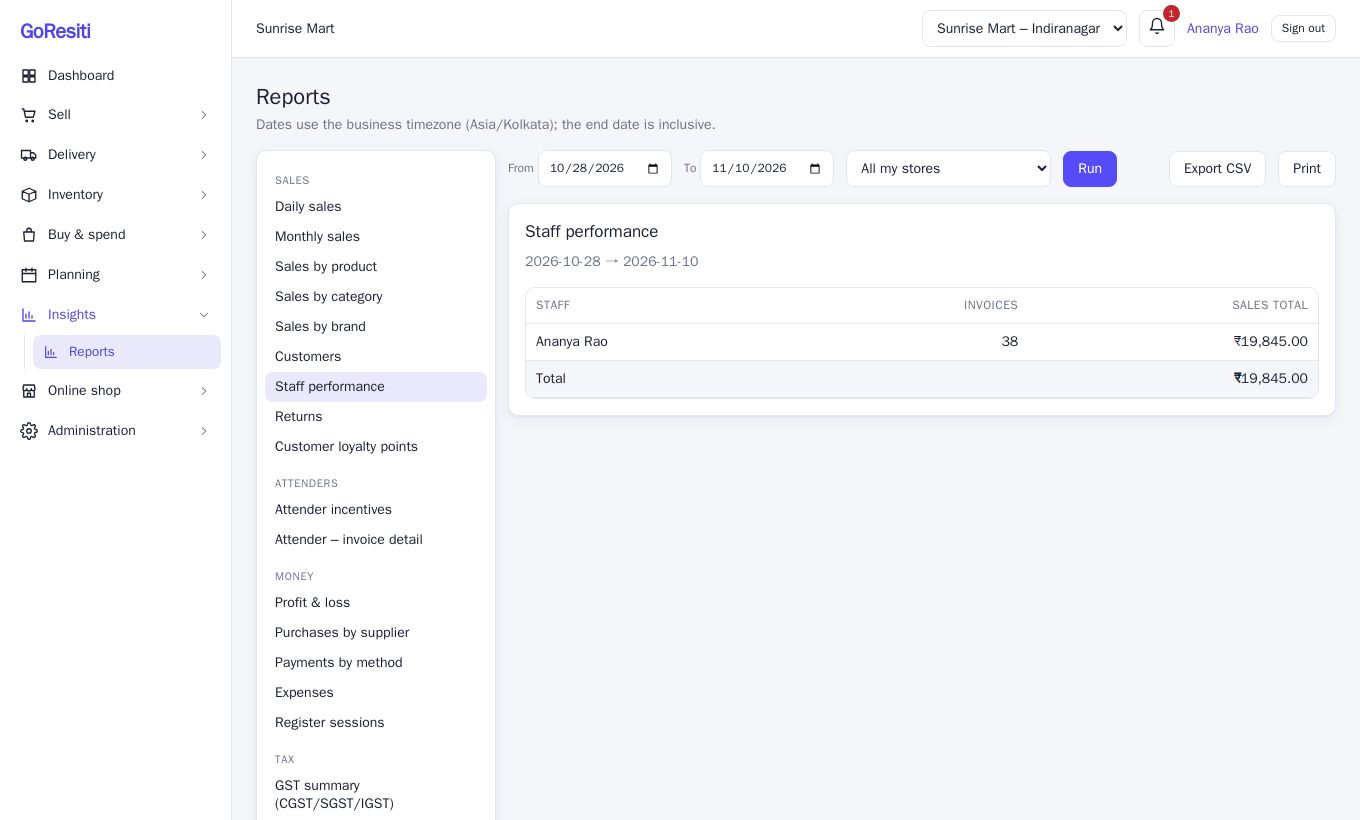
- Staff performance – invoices and sales total for each person who made sales. Online shop orders appear as "Online / system".
- Returns – every return with the date, the original sale, the reason, how it was refunded and the amount.
- Customer loyalty points – each customer's points balance, what it is worth, and points earned and redeemed in the period.
#Attenders reports
Only for workspaces that use attenders and incentives.
- Attender incentives – for each attender: invoices, sales (without tax), returns, net sales and the incentive earned. Incentive is calculated on net sales without tax, using the rate saved on each sale.
- Attender – invoice detail – pick an attender from the extra drop-down that appears, then click Run to see every invoice behind their incentive.
#Money reports
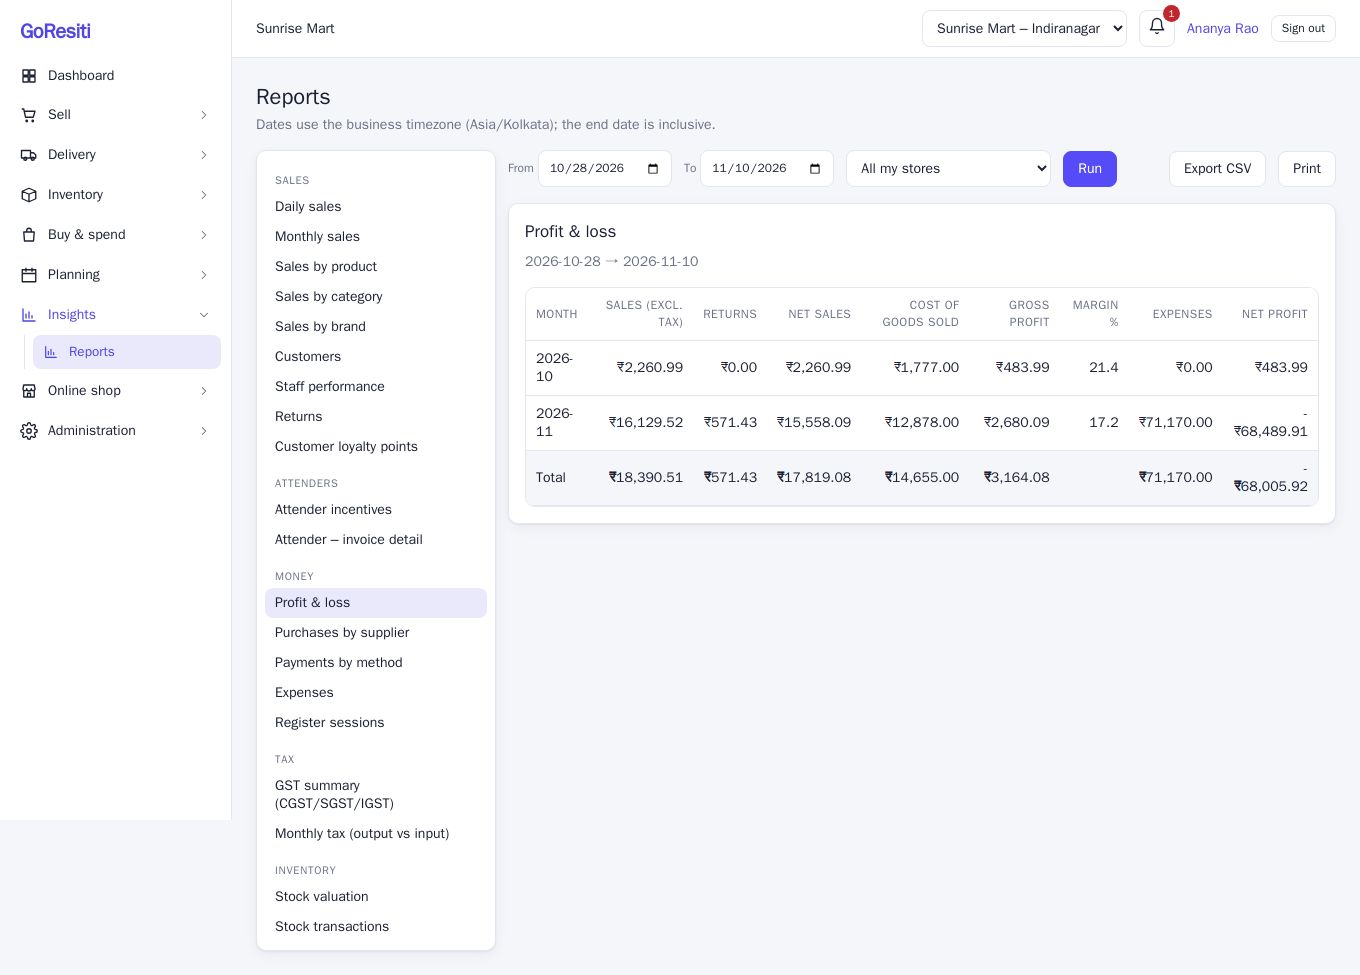
- Profit & loss – one row per month:
- Sales (excl. tax) is what you sold, without GST.
- Returns is taken off to give Net sales.
- Cost of goods sold (COGS) is what the items you sold cost you. Items that were returned are not counted.
- Gross profit is net sales minus cost of goods sold, and Margin % is gross profit as a percentage of net sales.
- Expenses is what you spent on running costs, and Net profit is gross profit minus expenses.
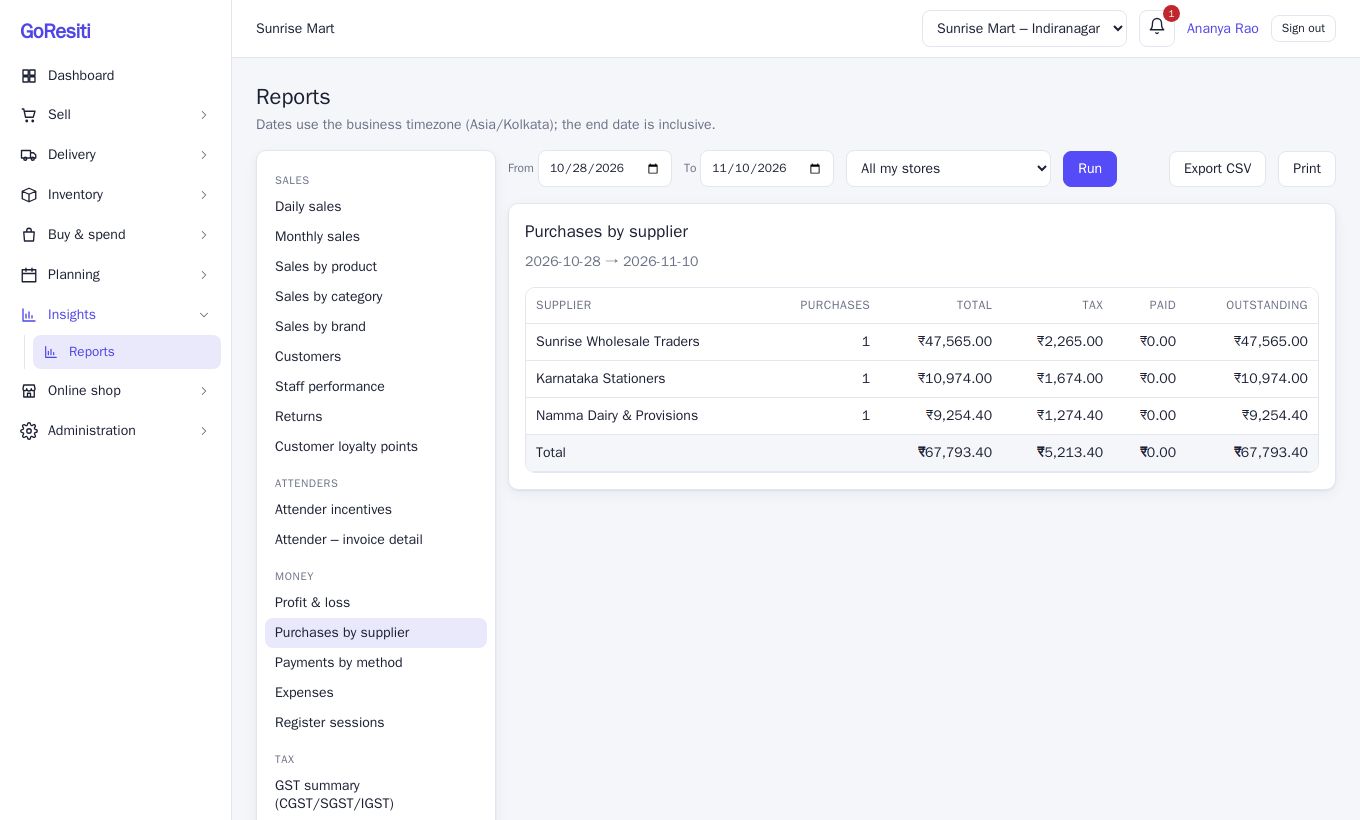
- Purchases by supplier – what you bought from each supplier, the tax, what you have paid and what is still outstanding.
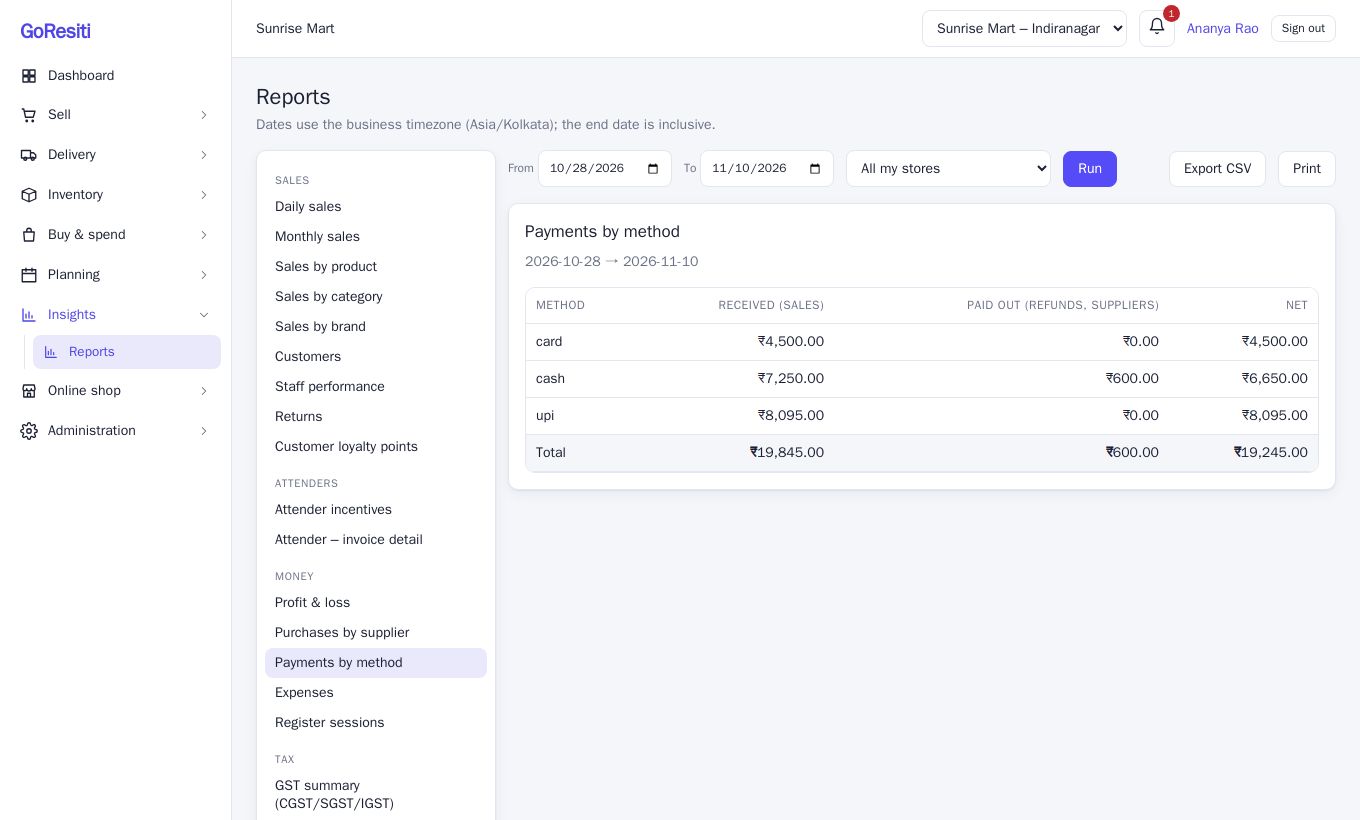
- Payments by method – money received and money paid out for each payment method (cash, UPI, card and so on). Net is received minus paid out. Paid out covers refunds and supplier payments.
- Expenses – spending grouped by expense category.
- Register sessions – each time a register was opened: who opened it, opening cash, expected cash, counted cash and the Variance (the difference). See Registers.
#Tax reports
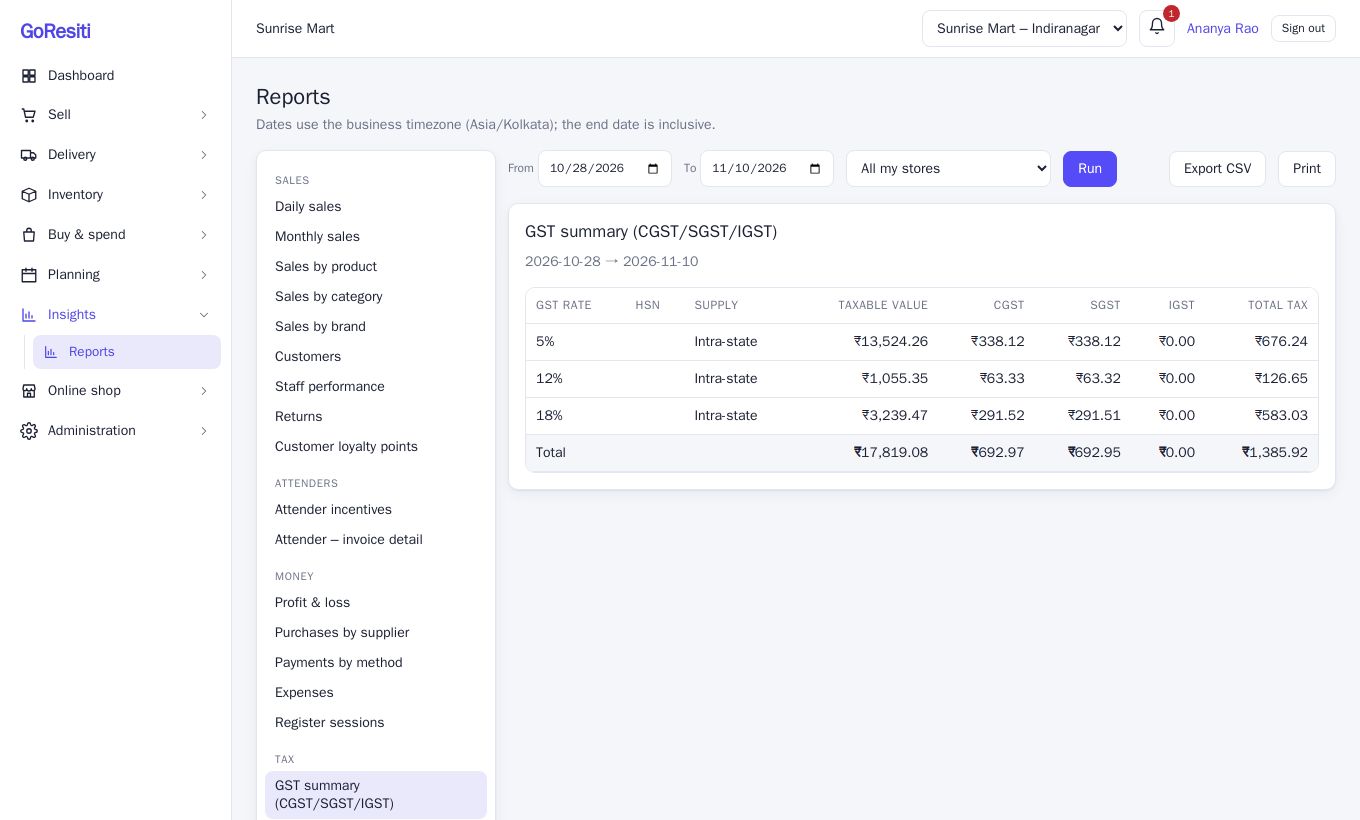
- GST summary (CGST/SGST/IGST) – tax you charged on sales, grouped by GST rate and HSN code. Each row says whether it was Intra-state or Inter-state:
- For intra-state sales, the tax is split equally into CGST and SGST.
- For inter-state sales, the whole amount is IGST.
- Returns are taken off, so the figures are net.
- Monthly tax (output vs input) – for each month, the tax you collected on sales (Output tax, after returns), the tax you paid on purchases you have received (Input tax), and the difference as Net payable.
#Inventory reports
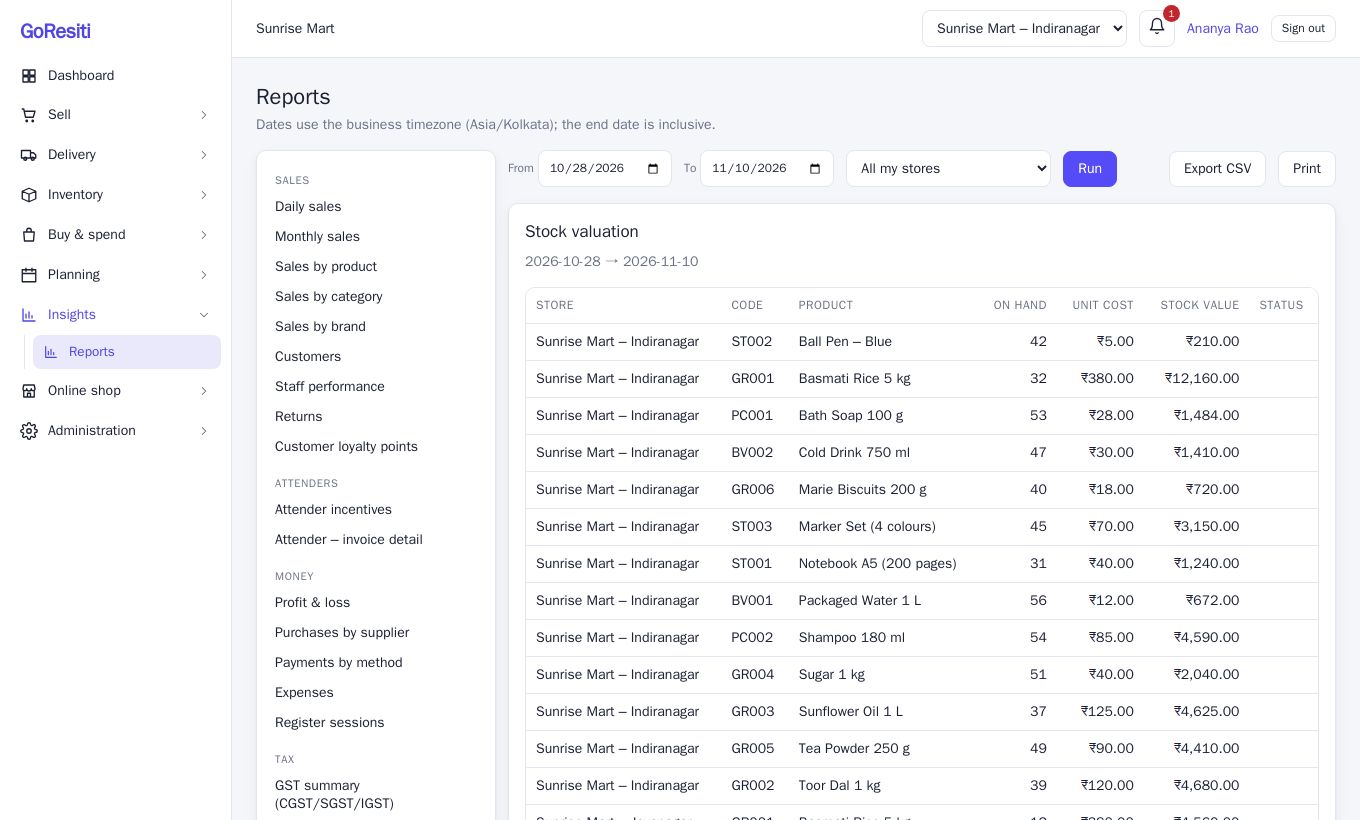
- Stock valuation – for each store and product: quantity on hand, unit cost, and stock value (quantity times cost). Items at or below their alert level are marked Low. The total is the value of your stock at current cost.
- Stock transactions – every stock movement (sales, purchases, adjustments, transfers) with the change and the balance afterwards. Shows up to the latest 2,000 movements in the period.
For day-to-day stock work, see Stock.
#Tips for reading reports
- Check the dates and the store before trusting a number. Most surprises come from a store filter left on one store.
- A report with no results shows No data for this period.
- Some reports are limited to the top rows (for example, 500 products or customers). Use a shorter date range if you need more detail.